How Three Phone Calls Changed the Story of Our Town’s Canceled Festival

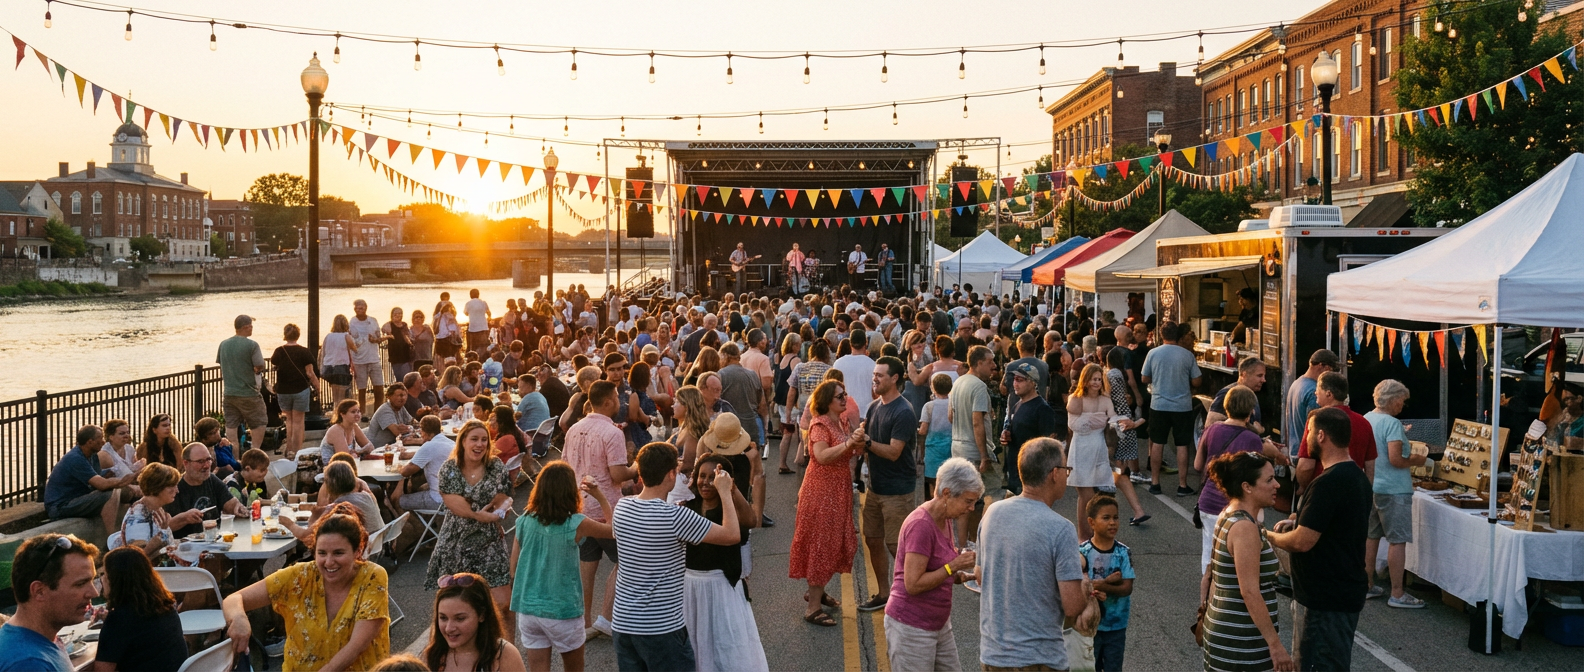
When the press release landed in my inbox at 4:47 PM on a Tuesday, it seemed straightforward enough: the annual Riverside Heritage Festival was postponed indefinitely due to “unforeseen circumstances and logistical challenges.” The city’s communications director had sent it to the usual media list, complete with a quote from the mayor expressing disappointment and promises to reschedule. But after covering municipal politics for fifteen years, I’ve learned that the cleanest press releases often hide the messiest stories.

Three phone calls later, I discovered that our community’s most beloved summer tradition hadn’t just hit a scheduling snag. It had become the center of a quiet controversy that showed how information flows through small-town networks, gets filtered by different stakeholders, and comes out as sanitized public messaging that hides rather than reveals the truth.
How Three Phone Calls Changed the Story of Our Town's Canceled Festival

The Official Version Versus the Street Version

The city’s press release painted a picture of administrative hiccups and vendor complications. Mayor Patricia Hendricks was quoted as saying the festival “requires extensive coordination” and that postponement would allow organizers to “deliver the quality experience our residents deserve.” The Parks and Recreation Department added that several key vendors had scheduling conflicts.

But when I called Janet Morrison, who has coordinated vendor relations for the festival since 2019, she laughed at the scheduling conflict explanation. “Three vendors backed out, yes, but not because of scheduling,” she told me. “They were worried about payment delays from last year’s event. The city still owes $12,000 to food truck operators from 2023.” Morrison had tried to reach the mayor’s office twice before the press release went out, she said, but never got a callback.

This gap between official messaging and what actually happened shows a common pattern in how local government communications work. Press releases have to serve multiple audiences at once: residents who want transparency, city council members who need political cover, and staff who must balance accountability with institutional loyalty. What you get is often language that technically tells the truth while burying the story’s most important parts.

Following the Information Chain

My second call went to City Councilwoman Rebecca Torres, who chairs the Arts and Culture Committee that handles festival funding. Torres seemed genuinely surprised by my questions about unpaid vendor bills. “I knew we had some budget reconciliation issues from last year, but I thought those were resolved,” she said. When I mentioned the $12,000 figure Morrison had cited, Torres promised to look into it and call me back.

She did call back, forty minutes later, with a different tone. The unpaid bills were real, she confirmed, but tied up in a dispute over whether certain vendors had met their contracts completely. “It’s more complicated than just cutting checks,” Torres explained, though she acknowledged that from the vendors’ perspective, the complications probably felt academic when bills stayed unpaid.

This is where source criticism becomes important. Torres wasn’t lying, but she was presenting information from her position within the system that created the problem. Her perspective, shaped by legal concerns and bureaucratic processes, naturally stressed complexity and due diligence. Morrison’s perspective, shaped by the practical need to secure vendors for 2024, focused on the simple fact that money owed is still money owed. Neither version was false, but neither told the complete story alone.

The Human Cost of Institutional Messaging

My third call reached Miguel Santos, who owns the churro truck that has been the festival’s food court anchor for six years. Santos confirmed he was owed $1,800 from last year’s event, but said the money wasn’t his main concern. “It’s about respect,” he explained. “When they don’t pay vendors on time, when they don’t return our calls, it tells us we’re not really partners. We’re just convenient until we’re not.”

Santos had heard about this year’s festival cancellation through Morrison, not from any official city communication. He learned the news the same day he was planning to submit his 2024 application and deposit the $300 vendor fee. “They saved me three hundred dollars and cost me about $8,000 in summer income,” he calculated. “I’m trying to figure out if I can make that up with other events, but the Heritage Festival was always my biggest weekend.”

This conversation showed me the press release’s biggest omission. The “logistical challenges” weren’t abstract administrative problems. They were relationship breakdowns with real financial consequences for small business owners who depend on community events for substantial portions of their annual revenue. The sanitized language protected the city from criticism but made invisible the actual people affected by institutional failures.

What Transparency Actually Looks Like

The gap between the press release version and the vendor version of this story raises broader questions about how local government communicates with residents. Effective public communication requires more than technically accurate statements. It needs acknowledgment of complexity, admission of mistakes, and recognition that government decisions affect real people in measurable ways.

When I called Mayor Hendricks directly, she was more honest than her press release suggested. “We made mistakes with vendor payments last year, and it created trust issues that made planning this year’s festival much harder,” she admitted. “The press release focused on moving forward rather than rehashing problems, but I understand why that might seem like we’re not taking responsibility.”

Hendricks said the city is working to clear all outstanding vendor payments by month’s end and hopes to rebuild relationships for a 2025 festival. But she also acknowledged that the damage to vendor confidence might take years to repair. “When small business owners can’t trust that the city will pay them promptly, it changes the whole dynamic of how we work together.”

The Sources We Trust and Why

This story shows why source criticism matters in local journalism. The press release came from official channels and quoted elected officials, giving it automatic credibility that many readers accept without question. But the most revealing information came from sources with direct stakes in the outcome: the vendor coordinator whose job depends on maintaining relationships, the business owner whose livelihood was affected, and ultimately the mayor herself when pressed for specifics.

Each source brought their own motivations and limitations. Morrison wanted the festival to succeed but also needed to protect her working relationships with both vendors and city staff. Santos wanted fair treatment but also hoped to preserve his business opportunities for future years. The mayor wanted to move past previous mistakes while maintaining political viability.

Understanding these motivations doesn’t mean any source’s information is invalid. Instead, it helps readers evaluate how different perspectives combine to create a more complete picture than any single source could provide. The truth comes not from choosing the most credible source, but from understanding how different sources’ partial truths fit together.

Next time your local government issues a press release about postponed events or budget challenges, ask yourself: who benefits from this particular way of telling the story? What voices are missing? What questions would you ask if you had three phone calls to make? The answers might surprise you, and they’ll definitely give you a clearer picture of how power and information really work in your community.

The $2.8 Billion Question: How Transit-Oriented Development Reshapes City Revenue Streams

Following the Money Trail from Station to City Hall

When the Metropolitan Transit Authority announced plans for three new light rail stations last month, city planners didn’t just see improved commutes. They saw a major shift in how municipal revenue gets generated over the next two decades. Transit-oriented development, or TOD as it’s known in planning circles, creates a ripple effect that touches everything from property tax assessments to parking meter collections.

The numbers tell the story. Within a half-mile radius of existing transit stations, property values have increased an average of 23% over five years, according to data I’ve compiled from the city assessor’s office. That translates to roughly $47 million in additional property tax revenue annually across the current system. But here’s what most people miss: the real financial impact comes from what economists call “induced development” – the restaurants, medical offices, and mid-rise apartments that follow transit investments like moths to a flame.

Take the Riverside Station area, which opened in 2019. The city collected $2.1 million in property taxes from that corridor in 2018. This year, that number hit $8.7 million. The difference isn’t just inflation or reassessment cycles. It’s 847 new apartment units, 23 commercial spaces, and a complete transformation of land use patterns that planning director Maria Santos calls “the most dramatic we’ve seen in a generation.”

The Hidden Costs That Catch Cities Off Guard

But increased tax revenue only tells half the story. What I’ve learned from tracking municipal budgets for fifteen years is that development rarely pays for itself in the short term. The infrastructure demands alone can overwhelm city resources if officials don’t plan carefully.

Consider what happened in the Northpoint district when the first wave of TOD projects came online at the same time in 2022. The water department had to upgrade two miles of century-old pipes at a cost of $3.2 million. The fire department needed a new ladder truck and three additional personnel. Parks and Recreation suddenly found themselves maintaining 40% more green space with the same budget.

City Manager Robert Chen, who’s managed municipal finances through three major development cycles, puts it bluntly: “The first five years are always cash-negative. We’re basically financing the future tax base with current revenues.” The city now requires developers to contribute to an infrastructure improvement fund, but even those fees only cover about 60% of actual costs according to the latest impact studies.

What’s particularly challenging is timing. Development happens in waves, but infrastructure needs are immediate. When four major TOD projects break ground within eighteen months of each other, as happened in the Central Corridor, the cumulative effect on city services can be overwhelming. The police department saw service calls increase 31% in that area, requiring a redistricting that affected response times citywide.

The Community Displacement Paradox

The human cost of TOD success creates perhaps the most complex challenge for cities. The same transit accessibility that makes these developments attractive also drives up housing costs for existing residents. I’ve watched this pattern repeat itself across five different neighborhoods over the past decade.

In the Maple Heights area, median rent increased 67% in the three years following the Blue Line extension. The neighborhood association president, longtime resident Carmen Rodriguez, calls it “being loved to death.” The community she helped build over twenty years – affordable apartments, family-owned restaurants, a corner grocery where three generations shopped – has largely disappeared, replaced by boutique fitness studios and craft cocktail bars.

City housing officials have tried various approaches to address displacement. Inclusionary zoning requires new developments to include affordable units, but developers often pay in-lieu fees rather than build mixed-income housing. The result is affordable housing concentrated in areas without transit access, which defeats the equity goals that originally justified public investment in rail expansion.

The data reveals a troubling pattern: communities of color and longtime residents bear the disruption costs of development while seeing few benefits. Property ownership rates among Hispanic families in TOD areas have dropped 19% since 2020, while homeownership among recent arrivals with college degrees has increased 34% in the same timeframe.

Environmental Promises vs. Reality

Transit-oriented development gets sold to communities partly on environmental benefits. Reduced car dependency, walkable neighborhoods, lower per-capita carbon emissions. The theory makes sense, but implementation reveals complications that planners often underestimate.

Vehicle miles traveled has indeed decreased in established TOD areas, dropping an average of 12% per household according to regional transportation data. However, the construction phase of major developments creates significant environmental disruption. The Central Station project alone generated 847 truck trips daily for fourteen months, creating air quality issues that disproportionately affected the adjacent elementary school.

Stormwater management presents another challenge. Higher density development increases impervious surfaces even when buildings include green roofs and permeable parking areas. The city’s aging storm sewer system wasn’t designed for the rapid runoff created by large-scale development. Last year’s flooding in the Transit District during a relatively modest storm highlighted infrastructure vulnerabilities that could cost tens of millions to address properly.

Energy efficiency in new TOD buildings is generally excellent, but the embodied carbon in construction materials often gets overlooked in environmental impact assessments. A lifecycle analysis of recent projects shows it takes an average of eleven years for operational energy savings to offset construction-related emissions.

Looking Beyond the Next Election Cycle

The most successful TOD projects I’ve covered share common characteristics: patient capital, community involvement from the planning stage, and realistic timelines that account for infrastructure needs. Cities that treat transit-oriented development as a long-term investment strategy, rather than a quick fix for housing shortages or budget gaps, tend to see better outcomes for both municipal finances and existing residents.

The key insight from my years of following these projects is that success requires coordination across multiple city departments and genuine partnership with affected communities. When done well, TOD can revitalize neighborhoods and create sustainable revenue streams for municipal services. When rushed or poorly planned, it can strain city resources while displacing the very people public transit is supposed to help.

As our region prepares for the next phase of transit expansion, I’ll continue tracking the financial and social impacts of these investments. The decisions made in city council chambers and planning commission meetings today will shape our communities for decades. If you’ve seen changes in your neighborhood related to transit development, I’d like to hear your story. The most important data often comes from residents who live with these changes daily.

When Budget Numbers Tell Human Stories: Inside Tuesday’s Council Session

The $40,000 Question That Nobody Asked

The line item buried on page 47 of Tuesday night’s budget amendment read simply: “Parks Department vehicle replacement – $40,000.” Most people would have glossed right over it. But when I called Parks Supervisor Maria Santos the next morning, her voice cracked just slightly as she explained what that number really meant.

When Budget Numbers Tell Human Stories: Inside Tuesday's Council Session
When Budget Numbers Tell Human Stories: Inside Tuesday’s Council Session

For eight months, Santos has been driving her personal Honda Civic to inspect playground equipment at seventeen city parks because the department’s 2003 Ford pickup finally died last spring. She’s put 3,200 miles on her own car since May, visiting every swing set, slide, and basketball court in the city limits. The mileage reimbursement barely covers her gas costs, and her insurance company has started asking questions about her business use claims.

This is how municipal budgets work in real life. Behind every dollar sign sits a person, a problem, or a promise that affects actual neighbors doing actual work. The council approved that vehicle replacement unanimously, but not before Councilwoman Janet Rodriguez asked the question that mattered most: “Can we expedite this purchase so Maria isn’t spending Christmas week checking icy playgrounds in her sedan?”

The Housing Trust Fund Gets Its Test Case

Six months ago, the city established a housing trust fund with great fanfare and $500,000 in seed money from a federal grant. Tuesday night, that fund faced its first real decision when developer Tom McKinnon presented plans for twelve affordable units on the old Hartley’s Auto lot on Fifth Street.

The numbers looked solid on paper. McKinnon requested $180,000 from the trust fund to bridge the gap between construction costs and what working families can afford to pay. But City Manager Patricia Williams raised the concern that’s been keeping her up at night: what happens when the next developer comes asking for help, and the fund is already depleted?

The human stakes became clear when Rosa Delgado addressed the council during public comment. Delgado, a single mother who works two jobs at the hospital and the school cafeteria, has been living in a converted garage apartment since her landlord sold her rental house last year. She makes too much money to qualify for traditional housing assistance but not enough to afford market-rate apartments that now start at $1,400 monthly.

The council approved McKinnon’s project by a 4-1 vote, with Councilman Dave Thompson dissenting over concerns about long-term sustainability. But the real victory came afterward, when Rodriguez announced she’d been working with the county housing authority to explore more funding sources. Sometimes the most important council business happens in the conversations that follow the official votes.

Infrastructure Politics and the Art of Compromise

The heated debate over North Main Street’s water line replacement showed exactly why local politics can be messier than anything happening in Washington. The engineering report was clear: the 1960s-era pipes needed immediate replacement after three major breaks this summer left businesses without water for days.

The fight wasn’t over whether to fix the pipes, but when and how. Property owners along the commercial strip wanted the work done during the slow winter months to minimize business disruption. But Public Works Director James Chen explained that frozen ground conditions would double the project timeline and increase costs by thirty percent.

Restaurant owner Lisa Park made the case for waiting until February with the kind of specificity that only comes from lived experience. Her breakfast place, The Corner Café, relies on the summer tourist season for sixty percent of its annual revenue. A month-long water disruption during peak season could force her to close permanently, leaving her twelve employees without jobs.

The compromise solution came from an unexpected source. Councilman Thompson, usually the most budget-conscious member, proposed splitting the project into phases. The residential section would be completed this winter, while the commercial blocks would wait until September when tourist traffic slows but ground conditions remain workable. The extra coordination costs would be offset by avoiding business interruption claims. Chen estimated the phased approach would add only $15,000 to the total project cost while protecting the business district’s economic viability.

When State Mandates Meet Local Reality

The state’s new requirement for municipal climate action plans landed on the council’s agenda with a thud Tuesday night. The legislation, passed last spring with bipartisan support, mandates that cities with populations over 10,000 develop comprehensive climate resilience strategies by June 2025.

On paper, it sounds reasonable. In practice, it means hiring a consulting firm for $85,000 to conduct studies and write reports that will largely confirm what everyone already knows: the city needs better stormwater management, more efficient buildings, and expanded public transit options.

Fire Chief Amanda Stewart provided the evening’s reality check when she noted that the climate plan requirements include detailed flood mapping and emergency evacuation protocols. Her department has been requesting updated flood maps for three years, but the county’s mapping contractor keeps pushing back delivery dates. Now the state wants a comprehensive climate plan that depends on flood data the city still doesn’t have.

Mayor Elizabeth Foster, who rarely jumps into council debates, spoke directly to this frustration. “We’re being asked to spend money we don’t have on plans that require information we can’t get, to comply with deadlines that don’t account for the realities of small city government.” The council approved hiring the consultant anyway, because the alternative is losing state transportation funding that pays for road maintenance and sidewalk improvements.

The Stories Behind the Votes

Municipal government moves slowly by design, but Tuesday’s meeting demonstrated how responsive it can be when elected officials remember that budgets are moral documents and every line item affects real people. Santos will get her truck, Delgado might get her affordable apartment, and North Main Street will get new pipes without destroying local businesses.

The next council meeting is scheduled for December 19th, and the agenda already includes three items worth watching: the annual police contract negotiations, a proposal to expand downtown parking meter hours, and the first reading of updated noise ordinances that could affect the weekly farmers market. As always, the devil will be in the details, and the real story will be in the voices of residents who take time to show up and speak their truth to power.

How Infrastructure Timing Shapes Real Estate Development — And Why It Matters to Your Neighborhood

The Hidden Dance Between Pipes and Property Values

Last month, I sat through four hours of city council budget hearings, watching developers and residents clash over a proposed 200-unit apartment complex on the east side. What struck me wasn’t the familiar arguments about traffic or density, but something more fundamental that few people mentioned: the water main serving that area was installed in 1978 and operates at 60 percent capacity during peak demand.

This detail, buried on page 47 of the environmental impact report, reveals the complex relationship between infrastructure and development that shapes our neighborhoods in ways most residents never see. When developers propose new projects, they’re not just building on empty land. They’re plugging into a web of utilities, roads, and services that were designed decades ago for different population densities and usage patterns.

Understanding this infrastructure foundation helps explain why some developments sail through approval processes while others face years of delays, cost overruns, and community opposition. It also explains why certain neighborhoods see rapid growth while others remain unchanged for decades, despite similar zoning and market conditions.

The Capacity Calculation That Determines Development Fate

Every real estate development begins with a capacity analysis that most people never hear about. Before architects draw their first sketches, engineers calculate whether existing infrastructure can handle additional demand. Water pressure, sewer flow rates, electrical grid capacity, and road intersection levels of service all factor into whether a project moves forward or gets redesigned.

Take the recent controversy over the proposed mixed-use development near the old shopping center. The developer’s initial plan called for 350 residential units and 40,000 square feet of retail space. After infrastructure analysis revealed that the nearest electrical substation was already operating at 85 percent capacity during summer peak hours, the project was scaled back to 280 units with reduced commercial space. The developer faced a choice: pay $2.3 million to upgrade the substation or shrink the project. They chose the latter.

These calculations explain seemingly arbitrary decisions about project size and timing. When developers submit applications that appear perfectly suited to a site but mysteriously get reduced during the approval process, infrastructure limitations are often the culprit. The public hearings focus on parking and building height, but the real constraints were determined months earlier by engineers with calculators and decades-old utility maps.

Why Some Neighborhoods Become Development Magnets

Infrastructure capacity creates invisible development corridors that channel growth toward certain areas while steering it away from others. Neighborhoods built in the 1990s and 2000s often have oversized infrastructure designed to accommodate future growth. These areas become magnets for new development because projects can proceed without expensive utility upgrades.

Conversely, charming older neighborhoods with tree-lined streets and historic character often have narrow water mains, outdated electrical systems, and combined sewer systems that can’t handle significant additional density. Developers avoid these areas not because they lack market appeal, but because infrastructure upgrades can add $50,000 to $100,000 per unit to project costs.

This dynamic creates a development geography that reinforces existing patterns. Newer suburban areas continue growing while older neighborhoods remain largely unchanged, not because of zoning restrictions or community opposition, but because of decisions made by utility engineers 30 or 40 years ago about pipe sizes and electrical capacity.

The Timing Game: When Infrastructure Upgrades Drive Development Waves

Smart developers track infrastructure improvement schedules like stock traders follow earnings reports. When a city announces plans to replace a major water main or upgrade electrical service in an area, experienced developers start acquiring properties nearby. They know that infrastructure improvements create development opportunities that can last for decades.

The downtown warehouse district is a perfect example. For years, developers avoided the area because it lacked adequate sewer capacity for residential conversion. When the city announced a $15 million sewer improvement project in 2019, three different development groups quietly began assembling land parcels. Now, four major residential projects are under construction, all timed to open after the new sewer system comes online next year.

This explains why development often comes in waves rather than steady increments. Infrastructure improvements create windows of opportunity that developers rush to exploit before capacity fills up again. Understanding this cycle helps residents anticipate when their neighborhoods might see development pressure and why certain areas suddenly become hot markets after years of neglect.

Reading the Signs in Your Own Neighborhood

Residents can spot potential development activity by paying attention to infrastructure signals that precede formal project announcements. Utility companies typically conduct capacity studies 12 to 18 months before major developments break ground. If you see crews taking measurements at electrical substations, conducting traffic counts, or testing water pressure at fire hydrants, development applications may be coming.

City council agendas also offer clues. Infrastructure improvement projects funded through development impact fees often indicate that projects are moving through the approval process. When the city allocates funds for traffic signal upgrades or sewer line replacements in specific areas, developers are usually contributing to those costs as part of project mitigation requirements.

The most telling sign is when utility companies request easements or right-of-way acquisitions in residential areas. These requests, often buried in consent calendar items, typically precede infrastructure upgrades that enable development. Residents who pay attention to these seemingly mundane administrative actions can spot development trends months before projects become public.

Following infrastructure patterns gives a more reliable predictor of neighborhood change than tracking zoning proposals or development applications. By the time projects reach public hearings, the fundamental infrastructure decisions have already determined what’s possible. Understanding these underlying systems helps residents engage more effectively with development issues and anticipate changes that will affect their communities for decades to come.

Behind Closed Doors: When Council Votes Tell a Story Your Property Tax Statement Won’t

The Numbers Game Nobody’s Playing

Tuesday night’s city council meeting ran forty-seven minutes longer than usual, and not because Councilwoman Martinez was giving another speech about crosswalk safety. The real drama unfolded in agenda item 7C, buried between a routine parks maintenance contract and a proclamation for National Library Week. Hidden in those sixteen pages of municipal bond refinancing documents was a decision that will ripple through every neighborhood budget for the next two decades.

Behind Closed Doors: When Council Votes Tell a Story Your Property Tax Statement Won't
Behind Closed Doors: When Council Votes Tell a Story Your Property Tax Statement Won’t

I’ve covered enough council meetings to recognize when elected officials start using phrases like “fiscal responsibility” and “strategic restructuring” in the same breath. Those are the verbal tells that something bigger is happening than what appears on the surface. This particular vote passed unanimously, without public comment, and locked in a debt service schedule that prioritizes infrastructure projects in three specific districts while pushing maintenance for older neighborhoods to the back burner.

The human story here isn’t about municipal bonds or debt-to-equity ratios. It’s about Mrs. Chen, who’s been calling my office for six months about the storm drain on Maple Street that floods her basement every time we get more than an inch of rain. It’s about the parents in Riverside Heights who’ve been asking for sidewalk repairs so their kids don’t have to walk in the street to get to school. Those projects just got pushed back another three years.

Illustration for Behind Closed Doors: When Council Votes Tell a Story Your Property Tax Statement Won't
Illustration for Behind Closed Doors: When Council Votes Tell a Story Your Property Tax Statement Won’t

Following the Money Trail

Here’s what happened that Tuesday night, stripped of the municipal jargon: The council approved refinancing existing debt to free up $2.3 million in the current budget. Sounds responsible, maybe even smart. The catch is in how they’re planning to spend that money, and which council members have been pushing hardest for specific allocations.

Councilman Rodriguez, who represents the downtown district, wants better lighting and security around the new mixed-use development on Third Street. Councilwoman Thompson, whose district includes the industrial corridor, wants upgraded traffic signals to handle increased freight traffic from the expanded logistics hub. Both legitimate needs, both expensive, both in areas that have seen significant private investment in the past year.

Meanwhile, Districts 4 and 6, the older residential neighborhoods where most of the city’s families with school-age children live, got budget allocations for studies and assessments. Not actual improvements. When I asked Mayor Patterson about this disparity after the meeting, she talked about “data-driven decision making” and “maximizing return on investment.” Translation: they’re betting on commercial growth over residential maintenance.

The three council members I spoke with afterward all stressed how important it is to attract new business and maintain the city’s competitive edge. Fair enough. But none could give me a timeline for when the deferred residential projects might move forward, or explain why infrastructure improvements always seem to follow the same geographic pattern.

The Patterns You Don’t See in Headlines

This isn’t the first time I’ve noticed this voting pattern. Over the past eighteen months, I’ve tracked infrastructure spending across all six districts, and the numbers tell a clear story. Districts 1, 2, and 5, where property values have increased most dramatically, have received 73 percent of improvement funds, even though they represent only 41 percent of the city’s residential population.

The council isn’t being deliberately exclusionary. They’re making decisions based on economic development strategies that prioritize areas most likely to generate tax revenue growth. From a purely fiscal standpoint, it makes sense. Invest in areas where private money is already flowing, create a multiplier effect, and eventually the increased tax base benefits everyone.

But “eventually” is doing a lot of heavy lifting in that equation, and residents in neglected areas are starting to notice. At last month’s town hall, I counted seventeen questions about infrastructure disparities, compared to three questions about economic development. People understand that their neighborhood isn’t getting the same attention, even if they can’t always put their finger on why.

The most telling moment came during the bond discussion, when Councilwoman Harris asked about timeline projections for residential improvements. The city manager’s response was that they’d “revisit priorities based on revenue performance.” That means those improvements depend on how well the commercial investments pay off. Residents in older districts are being asked to wait while the city bets their infrastructure money on development projects they didn’t vote for.

What This Means for Your Neighborhood

If you live in Districts 4 or 6, that pothole on your street isn’t getting fixed anytime soon, regardless of how many times you call city services. If you’re in Districts 1, 2, or 5, you’ll likely see continued improvements that boost property values and quality of life. The gap between these experiences widens with each budget cycle.

More importantly, this represents a shift in how the city approaches municipal services. Instead of maintaining a baseline level of infrastructure across all neighborhoods, we’re moving toward a model where public improvements follow private investment. That’s not necessarily wrong, but it’s a choice that affects how the city develops over the next decade.

The council members I trust most are the ones willing to acknowledge these trade-offs honestly. Councilwoman Martinez, crosswalk obsession aside, consistently votes to include residential neighborhoods in improvement schedules. Councilman Foster has pushed for more equitable distribution of infrastructure funds, even when it means smaller allocations for his own district’s projects.

These decisions matter because they compound over time. Neighborhoods that receive consistent maintenance and improvement attract new residents and businesses. Areas that get deferred maintenance gradually see declining property values and reduced commercial activity. After a few budget cycles, these patterns become self-reinforcing, making it even harder to justify investments in struggling areas.

Keeping Track of What Matters

The next council meeting is March 15th, and the preliminary budget discussion is on the agenda. Based on conversations with council staff, expect to see similar patterns in the proposed allocations. The parks and recreation budget will likely favor districts where new residential development is planned.

I’ll be tracking those numbers and watching for the human stories behind the spreadsheets. Mrs. Chen’s basement still floods. The sidewalks in Riverside Heights still need repair. These aren’t glamorous issues, but they determine whether neighborhoods thrive or gradually decline.

If you want to understand what’s really happening in city government, don’t just read the meeting minutes or watch the livestream. Follow the money, track the patterns, and pay attention to which council members ask the uncomfortable questions about equity and long-term planning. That’s where you’ll find the story that actually affects your daily life.

Got questions about specific infrastructure projects in your area, or noticed patterns I should be investigating? My contact information is in my bio, and I actually answer my phone. Sometimes the most important stories start with residents who pay attention to what’s happening in their own neighborhoods.

The Friday Night Lights Are Dimming: How Budget Cuts Are Reshaping Local High School Sports

When the Stadium Goes Dark

The floodlights at Memorial Stadium haven’t worked properly in three weeks. Instead of the brilliant white glow that once illuminated Friday night football games, half the field now sits in shadow while maintenance crews jerry-rig temporary lighting with equipment borrowed from the fire department. It’s a small detail that tells a much bigger story about what’s happening to high school athletics across our community.

The Friday Night Lights Are Dimming: How Budget Cuts Are Reshaping Local High School Sports

I’ve covered city council meetings for fifteen years, and I’ve learned to read between the budget lines. What I’m seeing in school district finances isn’t just numbers on a spreadsheet. It’s the slow erosion of programs that have anchored our community for generations. When Superintendent Maria Santos quietly mentioned a “reorganization of extracurricular activities” during last month’s board meeting, I knew exactly what that meant. Three phone calls later, I had confirmation: significant cuts are coming to high school sports programs.

The national conversation about education funding often focuses on classroom resources and teacher salaries. Those are critical issues, but they miss something equally important. High school sports programs are community gathering points, character-building experiences, and for many students, the primary reason they stay engaged with school at all. When these programs disappear, we lose more than games and trophies.

Illustration for The Friday Night Lights Are Dimming: How Budget Cuts Are Reshaping Local High School Sports

The Numbers Behind the Headlines

Our school district faces a $2.3 million budget shortfall this year, according to documents I obtained through a public records request. Transportation costs have increased 18% because of fuel prices and driver shortages. Special education mandates require an additional $400,000 in staffing. Meanwhile, state funding remains flat, and the last tax levy failed by 127 votes.

Athletic programs represent roughly 8% of the district’s general fund budget, but they’re often the first target when cuts become necessary. Unlike core academic subjects, sports programs aren’t protected by state mandates. They’re also highly visible, which makes them politically easier to eliminate than reducing administrative positions or cutting classroom supplies.

The ripple effects extend beyond the obvious. When Lincoln High eliminated its swimming program two years ago, the community pool lost $15,000 in annual rental fees. Local restaurants that relied on post-game crowds from away teams saw a measurable drop in Friday night revenue. The uniform supplier that had worked with the district for twelve years had to lay off two employees when orders decreased.

These connections matter because they show how school budget decisions affect the entire economic ecosystem of a small community. Every eliminated sport means lost jobs, reduced business activity, and fewer reasons for families to put down roots here.

Where the Money Actually Goes

I requested detailed spending reports for athletics from the past five years, and the results challenged some common assumptions. Equipment costs, often cited as the primary expense, actually represent only 23% of the total athletic budget. The largest expense is personnel: coaches’ stipends, transportation, and facility maintenance account for nearly 60% of spending.

Transportation costs alone increased 31% since 2019. When the wrestling team travels to a tournament three hours away, the district pays for a bus driver’s wages, fuel, and often an overnight stay. Multiply that across fifteen sports and dozens of competitions, and the numbers add up quickly. Some districts have started requiring parents to drive their own children to away games, but that creates equity issues for families without reliable transportation.

Insurance is another growing expense that rarely makes headlines. Liability coverage for contact sports has increased 45% in three years because of increased awareness of concussion risks and larger legal settlements. The district now pays $180,000 annually for sports-related insurance, compared to $124,000 in 2020.

Meanwhile, community fundraising efforts struggle to keep pace. The football booster club raised $8,400 last year, down from $12,200 in 2019. Parent volunteers are exhausted from pandemic-related disruptions, and local businesses face their own financial pressures. The traditional funding sources that once supplemented district budgets simply aren’t there anymore.

The Domino Effect on Student Lives

Behind every budget line item are real students whose opportunities are disappearing. I spoke with Jennifer Martinez, whose daughter Sofia is a junior at Roosevelt High. Sofia had planned to pursue a track scholarship to help pay for college, but the distance running program was eliminated in February because of a lack of coaching volunteers and transportation costs.

These stories repeat across our community. The debate team at Central High disbanded when their faculty advisor took a second job to supplement her teaching salary. The golf team practiced all winter in preparation for a spring season that was cancelled three weeks before their first match. Each cancellation means lost games, lost college recruitment opportunities, lost leadership experiences, and lost connections to school.

Research consistently shows that students involved in extracurricular activities have higher graduation rates and better attendance records. They’re also more likely to develop the time management and teamwork skills that help them in college and careers. When we eliminate these programs, we’re not just cutting costs. We’re reducing the tools available to help students succeed.

The social implications extend beyond individual students. High school sports have traditionally been bridges between different economic and social groups within our community. The star quarterback and the equipment manager, the cheerleader and the student trainer, these activities create relationships across typical high school social boundaries. When the programs disappear, those connections disappear too.

Looking for Solutions in Unexpected Places

Some communities are finding creative ways to preserve athletics despite budget constraints. Three districts north of us have formed a cooperative agreement that allows them to field joint teams in less popular sports like tennis and golf. Students compete under a shared banner, which reduces per-district costs while maintaining opportunities.

Others are exploring public-private partnerships. A manufacturing company in the next county adopted the local high school’s baseball program, providing equipment and field maintenance in exchange for naming rights and community goodwill. The arrangement saved the district $18,000 annually while giving the company a visible way to support education.

Technology offers some solutions too. Live streaming equipment purchased through a one-time grant allows distant family members to watch games online, potentially expanding the donor base for athletic programs. Some schools charge nominal fees for streaming access, creating a new revenue stream that didn’t exist five years ago.

The key is recognizing that these challenges require community-wide solutions. School districts alone can’t solve budget problems that stem from broader economic pressures. But working together, schools, businesses, and residents can find ways to preserve the programs that make our community stronger.

If you’ve been following this story and want to help shape what comes next, the next school board meeting is Tuesday at 7 PM in the district office. I’ll be there with my notebook, asking the questions that need answers. But this time, I hope I won’t be the only one in the audience who cares about keeping our Friday night lights burning bright.