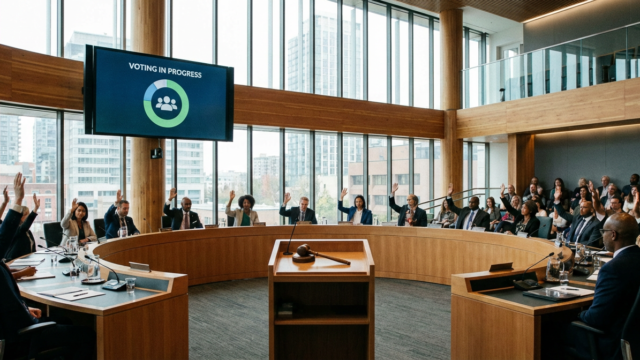
Why Three Minutes of Public Comment Changed Everything at Tuesday’s Council Meeting

What happens when a grieving mother stands at a podium for three minutes and changes the trajectory of a $2.4 million infrastructure project? I found out Tuesday night, sitting in the back row of Council Chambers with my usual stack of budget documents and a thermos of coffee that had gone cold hours earlier.

Maria Santos wasn’t on my list of expected speakers for the evening’s agenda. The 47-year-old nurse had never addressed the council before, never filed a public records request, never even attended a meeting. But when she stepped up to speak during public comment about the proposed speed bump installation on Maple Street, her voice carried the weight of every parent who has watched their child walk to school on a street that doubles as a shortcut for morning commuters.

Why Three Minutes of Public Comment Changed Everything at Tuesday's Council Meeting

The Numbers Behind the Emotion

The Maple Street corridor improvement project had been buried in agenda item 7B for six months. A straightforward traffic calming measure that would install twelve speed bumps between Roosevelt Elementary and the community center. City Engineer David Chen had presented clean data: average speeds of 38 mph in a 25 mph zone, 847 vehicles during school hours, zero accidents in the past three years.

Santos brought different numbers. Her eight-year-old son Diego times his walk to school every morning, she told the council. Four minutes and thirty-seven seconds from their front door to the crosswalk, where he waits for crossing guard Patricia Williams to wave him across. Williams has been requesting additional safety measures for two years through official channels, Santos noted, submitting three separate reports that apparently never made it past the Parks and Recreation department.

Council member Janet Rodriguez immediately pulled out her phone. Within five minutes, she had Williams on speaker, confirming details that should have been part of Chen’s original presentation. The crossing guard’s daily logs, meticulously kept in a composition notebook, showed seventeen near-miss incidents since school started in August.

When Process Meets People

The disconnect revealed Tuesday night shows a persistent challenge in local governance: how thoroughly researched proposals can still miss critical community input. Chen’s traffic study, conducted by professional consultants over a three-month period, included speed monitoring, accident analysis, and pedestrian counts. It did not include conversations with the people who use the street every day.

Mayor Susan Walsh, who typically runs meetings with military precision, paused the proceedings to ask Santos and Williams to join city staff at the table. For twenty minutes, the formal agenda disappeared as the council heard about morning traffic patterns from residents rather than consultants. Williams described how delivery trucks use Maple Street to avoid the construction zone on Third Avenue, creating blind spots near the school entrance. Santos’s neighbor, retired mechanic Frank Torres, explained how the street’s slight downhill grade encourages speeding, especially during afternoon pickup times.

This isn’t the first time resident testimony has reshaped a council decision. Last spring, small business owner Carmen Rodriguez’s three-minute comment about downtown parking meters led to a six-week revenue analysis that ultimately saved the historic district from losing weekend foot traffic. The previous winter, high school student Alex Chen’s presentation on late-night bus service resulted in extending Route 12 hours to accommodate students working evening jobs.

The Real Cost of Community Safety

By 9:30 PM, what started as a routine infrastructure approval had turned into something more complex. Council member James Morrison pulled up the city’s Vision Zero commitment, adopted unanimously in 2019, which pledges to eliminate traffic deaths and serious injuries by 2030. The Maple Street project’s $47,000 budget suddenly looked inadequate when measured against this broader safety framework.

Finance Director Linda Park ran new numbers in real time, calculating the cost of adding crosswalk improvements, enhanced signage, and a flashing beacon system that Williams had researched on her own time. The enhanced package would total $89,000, requiring council to reallocate funds from the general capital improvement reserve.

Rodriguez made the motion to approve the expanded scope, seconded immediately by Morrison. The vote was unanimous, but more importantly, it established a new protocol. Future traffic safety projects will now include mandatory community input sessions before final design, with particular attention to feedback from school personnel, crossing guards, and neighborhood watch coordinators.

Beyond Tuesday’s Vote

The Maple Street decision reflects broader changes in how our city council approaches community engagement. Walsh announced plans for quarterly neighborhood forums, rotating through different areas of the city to gather input before issues reach the formal agenda stage. Public Works Director Michael Torres will begin attending elementary school pickup times to observe traffic patterns firsthand, supplementing data collection with direct observation.

These changes matter because they address a fundamental question about representative democracy: how do elected officials balance professional expertise with community knowledge? Santos’s three minutes demonstrated that residents possess critical information that surveys and studies often miss. Williams’s crossing guard logs provided more useful insights than months of traffic counting equipment.

The enhanced Maple Street improvements will begin construction in January, with completion scheduled before the spring semester. Santos will join the city’s new Community Safety Advisory Committee, along with Williams and two other crossing guards from different schools. Their first assignment: reviewing traffic patterns around all elementary and middle schools to identify similar safety gaps before they require emergency intervention.

Tuesday’s meeting ran until 10:15 PM, longer than usual, but it ended with something rarely seen in municipal government: applause from the gallery. Not for the council’s decision, but for the process that led to it. When community members feel heard rather than processed, when their expertise is valued alongside professional analysis, local government works the way it was designed to work. Every neighborhood deserves advocates who understand that the best data often comes from the people who live the reality those numbers represent.


Why Economic Development Incentives Keep Missing the Mark in Mid-Sized Cities

The Promise That Never Quite Delivers

Every few months, another press release lands in my inbox announcing a new economic development initiative. The language is always the same: job creation, tax base expansion, transformational growth. After covering municipal government for fifteen years, I’ve watched dozens of these programs launch with fanfare and fizzle out in obscurity. The pattern is so predictable that I keep a template for these stories, filling in the blanks with new company names and dollar amounts.

Why Economic Development Incentives Keep Missing the Mark in Mid-Sized Cities

The latest example crossed my desk last week when I called three city council members about the proposed $2.4 million incentive package for a logistics company. Each gave me slightly different numbers for projected jobs, and none could explain why this deal differed from the warehouse project that left town after collecting its tax breaks two years ago. This disconnect between promise and reality isn’t unique to my coverage area. It’s happening in mid-sized cities across the country, where economic development has become an expensive game of municipal roulette.

The problem isn’t corruption or incompetence, though those certainly exist. Most economic development strategies were designed for a different era, when manufacturing dominated local economies and companies stayed put for decades. Today’s mobile businesses and service-based economy need entirely different approaches, but many cities still use playbooks written in the 1980s.

Illustration for Why Economic Development Incentives Keep Missing the Mark in Mid-Sized Cities

Following the Money Trail

I spent three weeks digging through budget documents and tax records to understand how incentive dollars actually flow in practice. The results show a system that puts headlines over outcomes. Cities typically offer property tax abatements, infrastructure improvements, or direct cash payments to attract businesses. These packages sound modest in isolation, but they add up quickly when you factor in lost revenue over multiple years.

Consider the numbers from my own city’s economic development authority. Over the past five years, we’ve committed $18 million in various incentives to attract eleven companies. Of those eleven, three have already left or significantly reduced their workforce. Two others never met their job creation targets but kept their tax breaks anyway. The five success stories created roughly 400 permanent jobs, meaning we spent $45,000 per job created. That calculation doesn’t include the opportunity cost of foregone tax revenue that could have funded schools, infrastructure, or other public services.

The tracking systems for these programs are often terrible. When I requested performance data from the economic development office, I received spreadsheets with missing entries and conflicting job counts. The compliance monitoring happens sporadically, usually only when local media or citizen groups ask pointed questions. This lack of accountability creates a situation where companies can make promises they never intend to keep.

What Actually Works in Modern Economic Development

The cities that succeed today focus on basics rather than flashy incentive packages. They invest in education partnerships, upgrade digital infrastructure, and create regulatory environments that support entrepreneurship. These approaches take longer to show results, which makes them politically challenging, but they build sustainable economic foundations.

I’ve covered several examples of this alternative approach during reporting trips to similar-sized cities. In Ohio, a former manufacturing town redirected its economic development spending from business incentives to a community college partnership that trains workers for healthcare and technology jobs. The program costs less per year than a single large incentive package, but it has produced steady job growth across multiple sectors. The key difference is that these jobs exist regardless of any individual company’s decisions.

Another effective strategy involves clustering related businesses and supporting services. Instead of chasing every prospect that shows interest, successful cities identify their existing strengths and build on them systematically. This requires patience and long-term thinking, qualities often in short supply during election cycles. But it creates economic systems that can adapt when individual businesses leave or change direction.

The Hidden Costs of Chasing Headlines

The opportunity cost of poorly designed incentive programs extends beyond the direct financial impact. Cities that constantly chase large employers often neglect the small businesses and entrepreneurs who form the backbone of local economies. These smaller enterprises rarely receive tax breaks or infrastructure improvements, even though they typically create more jobs per dollar of public investment.

I’ve interviewed dozens of small business owners who struggle with basic infrastructure problems while watching their tax dollars fund incentive packages for out-of-state corporations. The resentment is real and justified. A restaurant owner recently told me she’s been requesting sidewalk repairs for three years while the city spent $800,000 on site preparation for a distribution center that employed twelve people. These stories show how incentive-focused development can actually undermine community cohesion.

The political dynamics also create perverse incentives for elected officials. Announcing a major business recruitment generates immediate media attention and campaign talking points. The long-term costs and modest results emerge years later, often after those officials have moved on to other positions. This creates a cycle where short-term thinking drives policy decisions with multi-decade consequences.

Building Accountability Into the System

Reforming economic development requires structural changes, not just better intentions. Cities need standardized metrics for measuring success, regular performance audits, and clawback provisions that recover incentive payments when companies fail to meet their commitments. These mechanisms exist in some jurisdictions but remain uncommon in mid-sized cities where economic development staff often lack the resources for comprehensive oversight.

Transparency also plays a major role in improving outcomes. When incentive negotiations happen behind closed doors, citizens cannot evaluate whether the deals serve public interests. I’ve pushed for open records access to economic development agreements in my coverage area, and the public scrutiny has already improved the quality of proposals. Companies are less likely to make unrealistic promises when they know those commitments will be publicly tracked and reported.

The most promising reforms involve shifting focus from recruiting individual businesses to building community assets that support economic growth broadly. This might mean investing in broadband infrastructure, educational programs, or quality-of-life improvements that make cities attractive to both businesses and workers. These investments benefit everyone, not just companies that receive special treatment.

After covering hundreds of city council meetings and budget hearings, I’ve learned that good economic development stories rarely make headlines when they happen. They emerge slowly through improved graduation rates, reduced vacancy rates, and rising median incomes. If you’re tracking similar issues in your community, I’d love to hear about innovative approaches or accountability measures that are working. The solutions will ultimately come from cities that are willing to experiment and learn from each other’s experiences.

Behind the Headlines: How National Housing Policy Shapes What Gets Built in Our Backyard

When Federal Dollars Meet Local Dreams

The shiny renderings posted outside the former Riverside Mill site tell only part of the story. Yes, the proposed 240-unit mixed-income development looks good with its promise of affordable housing and green space. But the real story lies in the maze of federal programs, tax incentives, and local zoning battles that will determine whether those drawings ever become reality.

Behind the Headlines: How National Housing Policy Shapes What Gets Built in Our Backyard

After sitting through three hours in Tuesday’s planning commission meeting and following up with calls to the developer, two city council members, and the regional housing authority director, one thing became clear: our local housing crisis isn’t just about local solutions anymore. Every major residential project now navigates a complex web of federal funding streams, each with its own requirements that fundamentally change what gets built and who gets to live there.

The Riverside Mill project, like dozens of others across mid-sized cities nationwide, depends on Low-Income Housing Tax Credits (LIHTC) to make the numbers work. But here’s what those polished presentations don’t tell you: accepting federal tax credits means 20 percent of the units must remain affordable for 30 years, the developer must hit specific income targets, and the project timeline stretches to accommodate federal review processes that can add 18 months to completion.

The Numbers Game Behind Affordable Housing

Housing Authority Director Sarah Chen walked me through the math that keeps her up at night. To qualify for LIHTC funding, developments must work with households earning no more than 60 percent of the area median income. In our county, that translates to $48,000 annually for a family of four. The catch? Market-rate apartments in the same complex will rent for $1,800 monthly, while the affordable units max out at $1,200.

This income targeting creates what Chen calls “the missing middle” problem. Teachers, police officers, and hospital technicians often earn too much to qualify for affordable housing but not enough to comfortably afford market rates. The result is housing that works for very low-income residents and higher-income professionals while leaving middle-income workers scrambling.

Developer Mike Torres, whose company has built four LIHTC projects in the region, explained why this gap persists. “The federal programs are designed to work with the lowest-income residents first, which is important,” he said during our phone interview Wednesday. “But it creates a situation where we’re not building for the firefighter or the bank teller. Those families end up pushed further out, driving longer commutes, because there’s no federal program specifically targeting their income level.”

How Local Zoning Amplifies National Trends

The federal influence on local development goes far beyond direct funding programs. Fair Housing Act requirements now factor into every zoning decision, as the Department of Housing and Urban Development looks at whether local policies accidentally concentrate poverty or exclude certain demographics.

City Planning Director Janet Morrison showed me the mapping software her office now uses to track demographic patterns across proposed developments. Red zones indicate areas where more affordable housing might trigger HUD scrutiny for concentrating low-income residents. Green zones highlight areas where affordable units could help achieve better income integration. These federal guidelines increasingly drive where developers can even propose new projects.

Last month’s controversial denial of the Elm Street townhome proposal shows this tension perfectly. While neighbors cited traffic concerns, the planning commission’s real worry was whether approving 40 market-rate units in the historically African American Oak Hill neighborhood would contribute to gentrification patterns that could jeopardize federal community development funding. The developer has since redesigned the project to include affordable units, but the episode shows how federal oversight now influences hyperlocal land use decisions.

Morrison also pointed to new federal infrastructure spending that will reshape development patterns for years to come. The $2.1 million the city received for downtown streetscape improvements comes with requirements to consider “equitable development” in future zoning decisions. Translation: federal transportation dollars now influence housing policy, creating ripple effects that most residents never see coming.

The Climate Factor Changes Everything

Perhaps nowhere is the federal-local connection more visible than in new energy efficiency requirements. The Inflation Reduction Act’s housing provisions offer significant tax credits for developers who meet strict sustainability standards, but those requirements add roughly $8,000 per unit in upfront costs, according to Torres.

The Riverside Mill project shows this new reality. To access federal tax credits worth $4.2 million, the developer committed to exceeding standard energy codes by 30 percent, installing electric vehicle charging stations, and using locally sourced materials where possible. These upgrades will reduce long-term utility costs for residents, but they also pushed the construction timeline back six months and required specialized contractors.

Environmental consultant Lisa Park, who worked on the Riverside Mill application, explained how federal climate goals now drive local housing design. “Every project that wants federal support has to prove carbon footprint reduction,” she said. “That means developers are choosing building materials, heating systems, even landscaping based on federal environmental standards rather than just local preferences or costs.”

What This Means for Future Development

The convergence of federal housing policy, climate requirements, and local zoning creates both opportunities and constraints that will define our city’s growth for the next decade. Projects that successfully navigate this system can access funding levels that make ambitious affordable housing viable. But the complexity also favors larger, more sophisticated developers while potentially squeezing out smaller local builders.

Council member David Kim, who chairs the housing committee, sees this federal involvement as ultimately positive despite the complications. “Yes, it’s more complex now,” he said during our conversation Thursday. “But federal support is the only way we’re going to build affordable housing at the scale our community needs. The private market alone wasn’t solving the problem.”

The Riverside Mill decision, expected at next month’s city council meeting, will signal how well our community can balance federal requirements with local priorities. More importantly, it will establish precedents for the dozen other mixed-income projects currently in various stages of planning.

Understanding these federal influences isn’t just policy wonk territory anymore. Every resident affected by housing costs, traffic patterns, or neighborhood change is feeling the impact of decisions made in Washington and implemented through local development projects. If you want to know what your neighborhood will look like in five years, the answers increasingly lie in federal program guidelines as much as local zoning maps.

Have you noticed federal requirements affecting development in your neighborhood? I’d like to hear about projects where these national policies are playing out locally. Send me your observations, and let’s keep tracking how federal housing policy changes our community.

Behind the Buzzwords: What Economic Development Really Means for Our Main Street

The Promise Machine Comes to Town

Every few months, another consultant in a crisp suit shows up at city hall with a PowerPoint presentation full of pie charts and promises. Tax increment financing districts. Public-private partnerships. Catalytic investments. The language of economic development has become so layered in jargon that most residents tune out before anyone explains what it actually means for their neighborhoods.

Behind the Buzzwords: What Economic Development Really Means for Our Main Street

But here’s what I’ve learned after covering three mayors and countless ribbon cuttings: the difference between genuine economic development and expensive theater often comes down to whether anyone bothered to ask what the community actually needs. Last week’s city council meeting offered a perfect case study when developer Marcus Chen presented plans for a $12 million mixed-use project on the old Brennan’s Hardware site.

The numbers sounded impressive. Sixty construction jobs. Thirty permanent positions. $200,000 in annual property tax revenue. What caught my attention, though, was Councilwoman Sarah Martinez’s question about wage levels. Chen’s answer was telling: most of those permanent jobs would pay between $12 and $15 per hour. In a city where median rent for a one-bedroom apartment hit $1,200 last month, those aren’t the kind of positions that help working families stay in their neighborhoods.

Illustration for Behind the Buzzwords: What Economic Development Really Means for Our Main Street

Following the Money Trail

Economic development incentives have a way of multiplying once politicians start talking about job creation. The Chen project qualified for a five-year tax abatement worth roughly $85,000 annually, plus access to a low-interest loan through the city’s revolving development fund. Add in the infrastructure improvements the public works department will need to make, and taxpayers are looking at a big investment.

I called budget director Tom Walsh to run the numbers. Even with the projected tax revenue increase, the city won’t break even on its incentive package for at least eight years. That assumes the business succeeds and all those promised jobs materialize. Walsh has been tracking these deals since 2015, and his spreadsheet tells a sobering story: roughly 40 percent of incentivized projects fail to meet their employment projections.

The pattern repeats itself across cities our size. A recent Brookings Institution study found that most local development incentives go to projects that would have happened anyway. The real winners are often developers who know how to navigate the application process, not the communities these programs claim to serve.

What Actually Works

Three blocks from the proposed Chen development, Maria Santos runs a small café that employs eight people year-round. She’s been asking the city for help with a $15,000 storefront renovation that would let her expand seating and hire two more workers. Her employees earn $18 to $22 per hour, well above the service industry average. But her project doesn’t qualify for development incentives because it’s too small to meet the minimum investment thresholds.

Santos represents the kind of organic economic development that actually builds community wealth. Her employees live in the neighborhood. They shop at local businesses. Their kids attend neighborhood schools. When I asked economic development coordinator Jennifer Kim about supporting smaller projects like Santos’s café, she pointed to staffing constraints and regulatory complexity.

Other cities have found ways around these obstacles. Portland, Oregon created a micro-enterprise loan program that provides low-interest financing for businesses investing less than $50,000. Rochester, New York simplified its permitting process for small business renovations and saw a 35 percent increase in storefront improvements within two years. These aren’t flashy initiatives that generate press releases, but they create the kind of steady, incremental growth that keeps neighborhoods healthy for decades.

The Infrastructure Reality Check

Any honest conversation about economic development has to acknowledge what’s happening beneath our streets. The water main on Elm Street is 70 years old. The storm drainage system floods three neighborhoods every time we get more than two inches of rain. Our broadband infrastructure can’t support the kind of knowledge-based businesses everyone claims to want.

City engineer Dave Kowalski estimates we need $40 million in infrastructure improvements over the next decade just to maintain current service levels. That’s roughly ten times what the city spends annually on economic development incentives. Yet every time council discusses infrastructure bonds, the conversation turns to whether taxpayers will accept the debt burden.

The irony is hard to miss. We’ll offer tax breaks to attract new development, but we struggle to maintain the basic infrastructure that makes development possible in the first place. It’s like inviting guests to a dinner party while the roof leaks and the plumbing backs up.

Building From the Ground Up

Real economic development starts with understanding what you already have. Our downtown has 15 vacant storefronts, but it also has established businesses like Murphy’s Bookstore and Goldberg’s Deli that have survived three economic downturns. The industrial corridor lost 200 manufacturing jobs in the past five years, but it still has rail access and affordable commercial space that smaller manufacturers need.

The most successful development initiatives I’ve covered have been led by people who live in the affected neighborhoods. When residents of the Riverside district organized to save their community center five years ago, they ended up creating a small business incubator that has launched twelve enterprises. None of those businesses required tax incentives. They needed affordable space, technical assistance, and a network of potential customers who already lived nearby.

That’s the kind of development work that doesn’t generate flashy press releases or ribbon-cutting ceremonies. It happens one business license at a time, one storefront renovation at a time, one neighborhood meeting at a time. It’s harder to measure and impossible to summarize in a PowerPoint slide, but it builds the kind of economic resilience that outlasts election cycles and consultant contracts.

Next week, city council will vote on the Chen development proposal. Before they do, residents might want to ask whether a $12 million project that creates thirty low-wage jobs represents the best use of public resources, or whether that same investment might yield better returns if spread across dozens of smaller initiatives. The answer matters more than most people realize, because economic development decisions made today will determine what our community looks like twenty years from now.

Behind Closed Doors: What Tuesday’s City Council Vote Really Means for Your Water Bill

The Numbers Don’t Tell the Whole Story

Tuesday night’s 4-3 vote to approve the water utility rate increase might look like just another line item in the city budget, but three phone calls to residents on Maple Street tell a different story. Sarah Chen, who works two jobs to support her elderly mother, did the math during her lunch break Wednesday. The proposed 18% increase over two years means an extra $47 monthly by 2026. “That’s groceries for a week,” she told me, her voice tight with the kind of stress that comes from choosing between necessities.

Behind Closed Doors: What Tuesday's City Council Vote Really Means for Your Water Bill
Behind Closed Doors: What Tuesday’s City Council Vote Really Means for Your Water Bill

Council members Patricia Williams, James Rodriguez, and newcomer David Kim voted against the increase, pointing to affordability concerns during what Williams called “the worst inflation crisis our residents have faced in decades.” But the majority won out, led by Mayor Thompson’s argument that delaying infrastructure repairs would cost way more down the road. The vote split exactly how you’d expect. The council’s fiscal conservatives joined Thompson in approving what they called “necessary maintenance investments.”

What the official minutes won’t capture is the tension in the room when Rodriguez asked city engineer Mark Stevens to explain exactly why the water main replacement project couldn’t be phased over four years instead of two. Stevens’ five-minute technical explanation about soil conditions and contractor availability felt rehearsed. Rodriguez wasn’t buying it. “We’re asking people to pay today for problems they didn’t create,” Rodriguez said, his words echoing through a chamber packed with residents who had already sat through two hours of budget presentations.

Illustration for Behind Closed Doors: What Tuesday's City Council Vote Really Means for Your Water Bill
Illustration for Behind Closed Doors: What Tuesday’s City Council Vote Really Means for Your Water Bill

Infrastructure Reality Meets Political Theater

The water main situation is messier than either side wants to admit. City records show that 40% of our water infrastructure dates to the 1960s, when the population was half its current size. The engineering report, which I got through a public records request last month, details seventeen “critical failure points” where pipe breaks could leave entire neighborhoods without water for days. Three of those points run directly under the elementary school and the senior center on Oak Avenue.

But here’s what the report doesn’t mention: the city has known about these problems for six years. Former Public Works Director Linda Hernandez flagged the deteriorating system in 2018, recommending a gradual rate increase to fund repairs. That recommendation sat in a filing cabinet while the council approved tax breaks for the new shopping complex downtown. Hernandez retired last year, frustrated by what she privately called “political paralysis” around infrastructure spending.

Current Public Works Director Tom Bradley, who took over in January, inherited this mess along with a federal mandate to upgrade the water treatment facility by 2025. The EPA doesn’t care about local politics or election cycles. They care about compliance, and the city’s options have narrowed to expensive emergency repairs or even pricier federal penalties. Bradley’s presentation Tuesday night laid out these realities in stark terms, but political theater took over before residents could fully understand what they were facing.

The Human Cost of Municipal Decisions

Maria Santos raised four children in the house on Pine Street where she’s lived for thirty-eight years. She came to Tuesday’s meeting because her neighbor told her about the water rate discussion, though she admits she usually avoids city hall. Santos works part-time at the library since her husband’s stroke limited his mobility, and their fixed income already feels stretched after property taxes went up last year. “I understand things cost more now,” she said when I called her Wednesday morning. “But nobody asked if we can afford more.”

Santos represents the people council members talk about but rarely hear from directly. She doesn’t follow municipal politics closely, doesn’t attend budget workshops, and learned about the rate increase from a form letter that came with her utility bill. The disconnect between city planning and resident reality becomes clear in conversations like ours. When I explained the infrastructure timeline and federal requirements, Santos listened carefully before asking the most important question: “Why didn’t they plan for this sooner?”

Council member Kim, who campaigned on transparency and fiscal responsibility, seems to get this frustration. He spent forty minutes after Tuesday’s meeting talking with residents in the parking lot, taking notes on their concerns. Kim told me he plans to propose monthly community forums where residents can ask questions about city spending before decisions reach the voting stage. “We can’t keep surprising people with bills for problems we should have solved years ago,” he said, echoing Santos’ sentiment about planning failures.

What Happens Next

The rate increase takes effect in January, but the real test comes in November when three council seats appear on the ballot. Williams and Rodriguez face re-election campaigns that will likely center on their votes against the water utility increase. Both have already signaled plans to make infrastructure planning and resident affordability central themes in their campaigns. Meanwhile, Mayor Thompson’s allies are quietly organizing support for candidates who back his “infrastructure first” approach to city spending.

The water main replacement project begins in March, starting with the critical sections near the school and senior center. Bradley expects the work to disrupt traffic and business access for six months, creating another potential headache for frustrated residents. The city has hired a communications consultant to manage public outreach during construction, though Rodriguez questioned whether that money might be better spent on additional emergency assistance for residents struggling with higher utility bills.

Federal infrastructure funding remains a possibility, but the application deadline passed while the council debated the rate increase. Bradley is exploring other grant opportunities, though he admits the city’s late start puts them at a disadvantage compared to municipalities that began planning infrastructure upgrades years ago. The pattern of delayed decisions and reactive governance continues, leaving residents to wonder whether their representatives have learned anything from this experience.

Next Tuesday’s council meeting agenda includes a discussion about establishing a long-term infrastructure planning committee. I’ll be there with my notebook and recorder, ready to ask the questions that matter most to residents like Santos and Chen. If you have concerns about the water rate increase or infrastructure planning, now is the time to speak up. The council’s contact information is on the city website, and public comment periods give residents a direct line to their representatives. Democracy works best when we all participate.

When City Hall Gets the Numbers Wrong: How Misleading Business Data Shapes Our Downtown Story

When City Hall Gets the Numbers Wrong: How Misleading Business Data Shapes Our Downtown Story

The Scanner Keeps Crackling

Why does everyone suddenly have an opinion about downtown when the monthly business report hits council chambers? Last Tuesday, as I listened to Mayor Patricia Hendricks announce that “seventeen new businesses opened their doors in the central district this quarter,” my scanner crackled with the usual post-meeting chatter. But something felt off about those numbers, the same way a veteran reporter learns to spot when a budget line item doesn’t quite add up.

I’ve been tracking business openings and closures in this city for twelve years, and I’ve learned that the story behind the statistics often tells us more about who’s controlling the narrative than what’s actually happening on Main Street. Getting accurate counts is hard enough. But understanding how those numbers travel from reality to podium, and what gets lost in translation? That’s the real challenge.

Three phone calls later, I had my answer. The city’s economic development office counts a business as “new” if it registers for a license, regardless of whether it ever opens. Meanwhile, closures only get tallied when someone bothers to formally surrender their license, which about thirty percent of failed businesses never do. Council member Janet Torres, who chairs the economic development committee, admitted she wasn’t aware of this discrepancy until I called.

The Source Chain Breaks Down

Economic development coordinator Michael Chen seemed genuinely surprised when I explained how his department’s methodology skewed the numbers. “We report what the state database shows us,” he said, referring to the business license system that feeds into monthly reports. But databases only capture what gets entered, and Chen acknowledged his office doesn’t verify whether licensed businesses actually operate.

This disconnect between data collection and reality creates a peculiar game of telephone. Chen’s office pulls raw numbers from the state system, summarizes them for department head Rebecca Walsh, who then briefs the mayor’s office. By the time those figures reach the public, they’ve been filtered through four different people, none of whom have walked downtown to see which storefronts are actually occupied.

I decided to test this system by conducting my own survey. Walking the six-block downtown core last Thursday, I counted fourteen vacant commercial spaces that still hold active business licenses according to city records. The massage therapy place on Fourth Street has been empty since March, but its license remains current. The boutique clothing store on Market Avenue closed in January, yet the city shows it as an active business because the owner never filed closure paperwork.

Chen promised to cross-reference the license database with utility connection records, which would provide a more accurate picture of actual business activity. “That’s a really good point,” he said. “We should be doing that.”

The Political Layer

Mayor Hendricks’ use of those inflated numbers wasn’t accidental. Her administration has staked its reputation on downtown revitalization, and positive business statistics support that narrative. When I reached her communications director, Sarah Fleming, she emphasized that the mayor relies on official data from city departments.

“The mayor presents the information she receives from staff,” Fleming explained. “If there are concerns about methodology, that’s something for the department heads to address.” This response reveals how information flows, or doesn’t flow, between city hall’s political and administrative sides. The mayor’s office wants good news to announce, and department heads provide it using whatever data collection methods they have.

Council member Torres, however, took a different approach when I shared my findings. She immediately scheduled a meeting with Chen’s office to review data collection procedures. “If we’re making policy decisions based on inaccurate information, that’s a serious problem,” she said. Torres represents the district that includes most of downtown, and she’s been fielding complaints from constituents about empty storefronts that supposedly house thriving businesses.

This political dynamic shapes how business statistics get presented and interpreted. Positive numbers support the current administration’s policies, while negative trends might suggest those policies aren’t working. The temptation to massage data, or simply not look too closely at methodology, becomes almost irresistible.

What the Real Numbers Reveal

After spending two weeks cross-referencing business licenses with utility records, building permits, and my own observations, I found the actual story: eight new businesses opened downtown this quarter, while twelve closed. That’s a net loss of four businesses, not the gain of seventeen that city hall reported.

The closures included familiar names: Rodriguez Family Restaurant, which served authentic Mexican food for six years before COVID-19 finally forced them out in August. Thompson’s Hardware, a downtown fixture since 1987, couldn’t compete with the big box stores and closed quietly in July. Maria Santos, who ran a small accounting firm from the second floor above the old pharmacy, moved her practice to a strip mall after her lease doubled.

But the openings tell a story too. Three of the eight new businesses are service-based operations that don’t require street-level storefronts: a web design consultancy, an insurance agency, and a tax preparation service. Only five new businesses actually contribute to the street-level vitality that downtown revitalization aims to achieve.

When I shared these corrected figures with Chen, he seemed relieved rather than defensive. “This gives us a much clearer picture of what’s actually happening,” he said. “We need to change how we collect and report this information.” He’s now working with the IT department to create a system that flags businesses when their utility accounts close, providing a more accurate closure count.

Following the Information Trail

This investigation revealed something larger than just bad bookkeeping at city hall. It showed how easily official statistics can diverge from reality when nobody questions the methodology behind them. Local media often reports these numbers without verification, creating a public perception that may be completely wrong.

The business community deserves accurate information about economic trends. Property owners need realistic data to make investment decisions. Citizens should know whether their tax dollars are actually supporting effective economic development policies. When city officials present inflated success metrics, it undermines trust and prevents honest assessment of what’s working and what isn’t.

Chen has committed to implementing quarterly physical surveys of downtown businesses, cross-referencing license data with utility records, and providing more detailed breakdowns of business types and locations. Mayor Hendricks’ office says it will wait for the new methodology to be established before making future announcements about business development.

The next time you hear a politician cite business statistics, ask yourself: where did those numbers come from, and who verified them? In an age of data-driven decision making, the quality of our information determines the quality of our choices. Our community deserves better than feel-good fiction disguised as facts.